


Calculating Food Cost Percentage
Your food cost percentage is simply the cost of your ingredients compared to your revenue from selling the final dish, shown as a percentage. At its core, it’s calculated like this: (Cost of Goods Sold / Total Food Sales) x 100. If you can get a handle on this one number, you’re well on your way to mastering your restaurant’s finances.
Why Food Cost Percentage Is Your Restaurant’s North Star

Let’s be real—running a restaurant is tough. You can have a full house every single night and still find yourself staring at the books, wondering where the profit went. More often than not, the answer lies with your food cost percentage. This single metric is the financial heartbeat of your kitchen.
Think of it less as a stuffy accounting term and more as your most powerful diagnostic tool. It’s the number that tells you if your menu prices are actually making you money, if your purchasing is on point, and if your kitchen crew is keeping waste in check. Operating without tracking it is like trying to navigate a ship in a storm without a compass.
More Than Just a Number
Getting a clear, consistent read on your food cost percentage unlocks some serious advantages for your restaurant:
- Smarter Menu Pricing: It gives you the hard data you need to price your dishes for profit, moving you beyond guesswork and gut feelings.
- Spotting Waste: If your percentage is creeping up, it’s a huge red flag for problems like over-portioning, food spoilage, or sloppy prep. You can jump on it immediately.
- Vendor Accountability: This number helps you see when supplier prices are inching up and gives you the leverage you need to negotiate better deals.
- Real Profitability Insights: It’s a straightforward, reliable way to measure your kitchen’s financial performance week after week, month after month.
For a deeper dive into this crucial metric and how it shapes your restaurant’s bottom line, check out this excellent guide on mastering your restaurant food cost percentage.
By consistently tracking your food cost percentage, you shift from being a manager who just reacts to problems to a leader who sees financial challenges coming and can act on opportunities before anyone else. It’s the ultimate lever for controlling your bottom line.
Hitting the Industry Benchmark
The ideal food cost percentage isn’t a secret. For years, the industry benchmark for a healthy operation has hovered between 28% and 35%.
If your numbers fall in this sweet spot, it generally means you’re covering your ingredient costs effectively while still leaving a healthy margin for profit. Nailing this target is absolutely critical for long-term survival, especially when food prices and labor costs are always in flux.
To get started, it’s crucial to understand the main variables that go into this calculation. This table breaks them down clearly.
Key Components of Food Cost Calculation at a Glance
| Component | Definition | Example |
|---|---|---|
| Beginning Inventory | The total value of all food and beverage stock you have on hand at the start of a period (e.g., the first day of the month). | At the start of April, you had $15,000 worth of ingredients in your walk-in and pantry. |
| Purchases | The total cost of all food and beverage supplies you bought during that same period. | Throughout April, you spent $8,000 on new inventory from your suppliers. |
| Ending Inventory | The total value of all food and beverage stock remaining at the end of the period (e.g., the last day of the month). | On the last day of April, your remaining stock was valued at $13,000. |
| Total Food Sales | The total revenue generated from selling food during that period. | Your total food sales for the month of April were $30,000. |
Having a solid grasp of these four components is the first step toward accurately calculating your food cost percentage and making informed decisions for your business.
The Essential Formula for Food Cost Calculation
Alright, let’s get into the numbers. Don’t worry, this doesn’t need to be complicated. At its heart, your food cost percentage comes down to one simple formula. This is the key to seeing exactly how your kitchen is performing financially over a specific period, whether that’s a week or a month.
Here it is: (Beginning Inventory + Purchases – Ending Inventory) / Total Food Sales.
Let’s unpack what each piece of that puzzle means. Think of it as a financial story about your inventory. Nailing this formula is a huge part of managing your restaurant’s finances. It’s actually a core component of the broader practice of calculating financial ratios, which every business owner needs to understand to gauge their overall financial health.
Defining Your Variables
Before you start plugging in numbers, you have to know exactly what they represent in your day-to-day operations. Getting these details right is what separates a fuzzy guess from a truly accurate calculation.
- Beginning Inventory: This is the total dollar value of every food item you had sitting on your shelves, in the walk-in, and in the freezer on the morning of day one for the period you’re measuring. It’s your starting point.
- Purchases: This is pretty straightforward—it’s the sum of every invoice for food you received from your suppliers during that period. Add it all up, from the big produce delivery to that small specialty order.
- Ending Inventory: Just like you did at the beginning, you need to count everything again at the very end of the period. The total dollar value of all the food you have left is your ending inventory. A precise count here is critical.
- Total Food Sales: Pull this number from your POS system. It’s the revenue you generated from selling food only. Be careful not to include alcohol or other beverage sales, as that will throw off your numbers.
This simple infographic helps visualize how all these numbers come together.
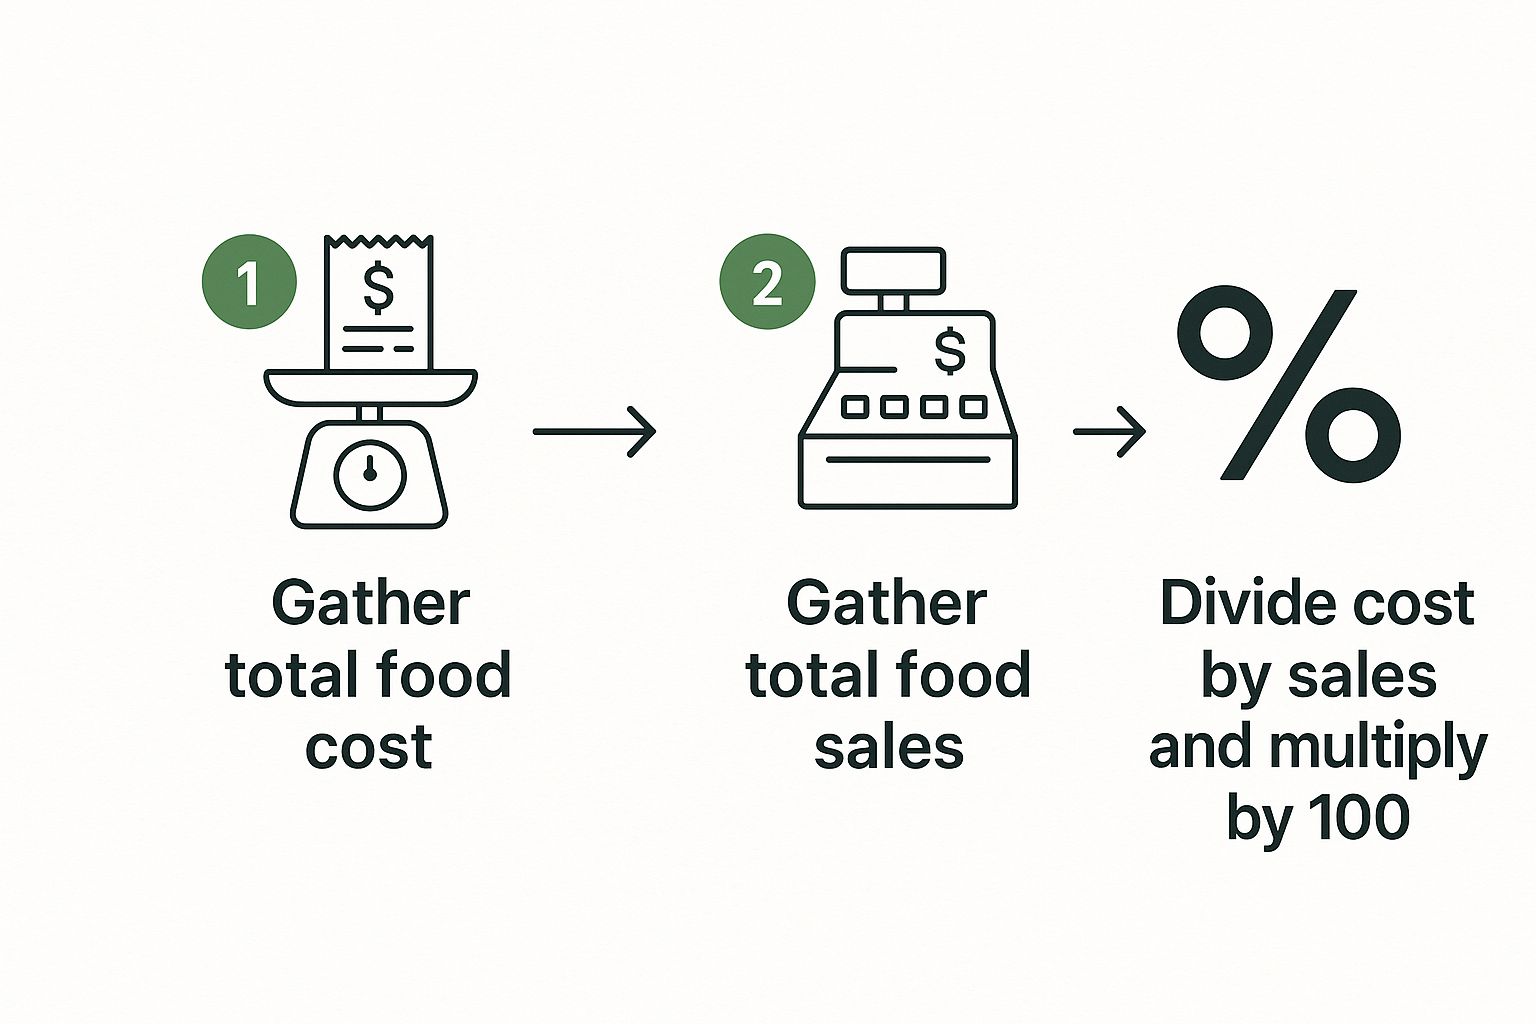
As you can see, it really boils down to a few key inputs that lead you straight to that final percentage.
Understanding Cost of Goods Sold (COGS)
When you look at the first part of the formula—Beginning Inventory + Purchases – Ending Inventory—what you’re actually calculating is your Cost of Goods Sold (COGS).
This number is incredibly important. COGS tells you the direct cost of all the ingredients you actually used to make the food you sold during that time. It accounts for what you started with, adds in what you bought, and then subtracts whatever you didn’t use.
Think about a neighborhood taqueria. Their COGS for the month would be the cost of all the tortillas, meat, cheese, produce, and spices that went into every single taco and burrito they sold. It’s the true cost of what walked out the door on customers’ plates.
Your Cost of Goods Sold is the engine of the food cost formula. Calculating it accurately means you’re not just tracking purchases; you’re tracking actual consumption, which provides a much clearer view of your kitchen’s efficiency.
Once you have your COGS figured out, the last step is a breeze. You just divide that number by your Total Food Sales for the same period. This will give you a decimal—multiply it by 100, and you’ve got your food cost percentage.
Putting the Formula into Practice
Formulas are great, but the real test is seeing how they hold up in the controlled chaos of a working kitchen. Let’s walk through a real-world scenario to see exactly how this calculation works from start to finish. This is where abstract numbers get turned into a powerful management tool you can lean on every single month.
Let’s use an example. Meet Alex, the owner of a bustling neighborhood bistro. Alex needs to pin down last month’s food cost to see if the bistro is hitting its profitability targets. To get there, Alex needs to pull four key pieces of data from the previous month.
Gathering the Core Numbers
First thing’s first: a data-gathering mission. Accuracy here is everything. Garbage in, garbage out, as they say.
Alex pulls together the following figures:
- Beginning Inventory: On the first day of the month, the total value of all food in the pantry, walk-in cooler, and freezers was $12,000.
- Purchases: Throughout the month, Alex spent $9,000 on new ingredients, which was confirmed by adding up all supplier invoices.
- Ending Inventory: On the last day of the month, a full count revealed $10,500 worth of food stock remained.
- Total Food Sales: The POS system shows that the bistro generated $35,000 in food revenue for the month.
With these four numbers ready, Alex can get to work. The whole process kicks off by figuring out the actual cost of the food that was used.
Calculating the Cost of Goods Sold (COGS)
Before we can find the final percentage, we need to calculate the Cost of Goods Sold (COGS). This number tells you the true cost of all the ingredients that actually went into the dishes you sold during that period.
The COGS formula is pretty straightforward: Beginning Inventory + Purchases – Ending Inventory.
Let’s plug in Alex’s numbers:
$12,000 (Beginning Inventory) + $9,000 (Purchases) – $10,500 (Ending Inventory) = $10,500 (COGS)
So, Alex’s bistro used $10,500 worth of ingredients to generate its sales last month. That single number is a vital piece of the financial puzzle, showing the direct cost of production.
Now for the final step.
Finding the Final Percentage
The last calculation is the easiest part. You just divide the COGS by your Total Food Sales and multiply by 100 to turn it into a percentage.
The formula looks like this: (COGS / Total Food Sales) x 100
Using Alex’s final figures:
($10,500 / $35,000) x 100 = 30%
There it is. Alex’s food cost percentage for the month is 30%.
This result isn’t just a number on a spreadsheet; it’s a critical performance indicator. A 30% food cost falls squarely within the healthy industry benchmark of 28-35%. It’s a strong signal that Alex’s menu pricing, portion control, and waste management are all on the right track.
This calculation confirms that for every dollar in food sales, 30 cents went directly to paying for the ingredients. That’s a strong, sustainable position for a bistro, indicating solid operational health and a good handle on profitability. Alex can now use this number as a benchmark to track performance in the months ahead.
Interpreting Your Food Cost Percentage
https://www.youtube.com/embed/si8jRV5qaA4
So, you’ve done the math and you have your number. Great. Now the real work begins.
Calculating your food cost percentage is just the first step. The magic happens when you understand what that number is actually telling you. A percentage on its own is just data, but when you put it into context, it paints a vivid picture of your restaurant’s financial health.
For most full-service restaurants, the sweet spot for food cost percentage hovers somewhere between 28% and 35%. If you’re landing in this range, you’re likely striking a healthy balance between what you pay for ingredients and what you charge on your menu, leaving enough margin to cover labor, rent, and—most importantly—turn a profit.
Decoding High and Low Percentages
But what if your number is way off? Don’t panic. Think of it as a diagnostic tool.
A high food cost percentage, maybe something like 40%, is an immediate red flag. It’s a sign that your ingredient costs are eating up way too much of your revenue. This usually points to a handful of common issues that need a closer look right away.
Here are the usual suspects behind a high percentage:
- Over-portioning: Are your line cooks getting a little too generous with the fries or adding an extra ounce of protein to every plate?
- Supplier Price Hikes: Have your vendor costs crept up without you adjusting your menu prices to match? It happens more often than you think.
- Kitchen Waste: How much perfectly good food is ending up in the trash? Spoilage, burnt dishes, and bad prep can kill your margins.
- Employee Theft: It’s tough to think about, but unaccounted-for inventory can quietly inflate your costs.
On the flip side, an unusually low percentage isn’t always something to celebrate. Seeing a number like 22% might feel like a huge win, but it could be a warning sign. It might mean your menu prices are too high for your market, which could be turning customers away. Or worse, it could mean you’re using cheaper, lower-quality ingredients, which can do long-term damage to your reputation.
Your food cost percentage is a diagnostic tool. A number outside the ideal range isn’t a failure—it’s an arrow pointing you directly to an area of your operation that needs a closer look.
Setting Realistic Targets for Your Menu
It’s also critical to remember that not every item on your menu will have the same food cost. Of course a prime rib dinner is going to have a much higher individual food cost than a simple pasta marinara. The goal isn’t to make every single dish hit that perfect 30% mark.
The real strategy is to create a balanced menu. You need high-profit, low-cost workhorses (think soups, pastas, and certain appetizers) to offset the more expensive, lower-margin showstoppers like that beautiful steak or fresh seafood. By understanding the ideal cost for each category on your menu, you can set much more realistic and effective targets for your specific concept.
The market is always changing, too, which means you have to stay on your toes. For example, global food prices jumped by nearly 10% in 2022, forcing every operator to adjust. You can find more insights on these trends over at Restaurant.org. This is exactly why running your food cost percentage consistently is so vital—it’s how you stay in control when the market gets unpredictable.
Proven Strategies to Lower Your Food Costs
Knowing your food cost percentage is like having the blueprint to your restaurant’s profitability. But a blueprint doesn’t build the house, does it? The real magic happens when you use that number to make smart, strategic changes in your kitchen. This is where you shift from just tracking expenses to actively steering your financial ship.
Bringing your food costs down doesn’t mean you have to start buying cheaper ingredients or shrinking every portion. Far from it. It’s about working smarter to slash waste and squeeze every drop of value from the inventory you already have. These are real, actionable changes you can make this week to see a tangible impact on your bottom line.
Master Your Inventory Management
The single biggest drain on your profits is often the food that never even makes it to a customer’s plate. Spoilage and waste are silent killers. Your best defense? A rock-solid inventory system.
Implementing a strict first-in, first-out (FIFO) system is completely non-negotiable. This just means organizing your walk-in and dry storage so older products are always used before newer ones. A simple roll of masking tape and a marker for labeling delivery dates can make this process foolproof for your entire team.
Beyond just organizing shelves and purchasing carefully, keeping a pristine kitchen is crucial. Implementing effective fly control strategies for restaurants can dramatically reduce spoilage and protect your reputation, directly cutting down on food waste.
Engineer Your Menu for Profitability
Your menu is so much more than a list of dishes—it’s your most powerful sales tool. Menu engineering is all about strategically designing your menu to nudge customers toward your most profitable items.
Start by digging into the individual food cost for each and every dish. You need to identify your “stars” (high popularity, high profit) and your “puzzles” (low popularity, high profit).
- Highlight Your Stars: Use visual cues like boxes, photos, or bold text to draw the eye to your high-margin superstars. Make them impossible to miss.
- Rework Your Puzzles: These dishes are profitable but just aren’t selling. Can you give the dish a more appealing name? Write a more enticing description? Maybe have your servers personally recommend it?
- Re-price Your Plowhorses: These items are super popular but have low profit margins. A small, strategic price bump here can have a huge impact on your overall numbers without scaring away loyal customers.
Think creatively about cross-utilization. A pizzeria owner I know started repurposing leftover pizza dough at the end of the night into garlic knots. This simple change turned potential waste into a new, high-margin appetizer, adding hundreds to his weekly profit.
This kind of thinking transforms would-be losses into real, tangible gains.
Build Strong Supplier Relationships
Stop treating your suppliers like interchangeable vendors. See them as partners in your success. A good relationship can unlock better pricing, first dibs on seasonal specials, and more flexible delivery schedules when you’re in a pinch.
Schedule regular meetings to talk about your volume and ask about potential discounts for bulk orders or early payments. And don’t ever be afraid to get competitive quotes. Simply letting a current supplier know you’re shopping around can often magically unlock better pricing.
Looking at the bigger picture, these cost-saving measures are vital for business health. In 2024, U.S. food-away-from-home spending hit 58.5% of the $2.63 trillion total food market, which shows just how much people love dining out. Mastering your food cost percentage lets you stay competitive and profitable in this booming market without alienating your customers.
Common Questions About Food Cost Percentage
Once you’ve got the basic formula down, the real-world questions start popping up. It’s one thing to calculate food cost in a spreadsheet, but it’s another to manage it day-to-day in a busy kitchen. The main formula doesn’t always account for the nuances you’ll face.
Think of this as the troubleshooting guide. Getting these details right is what separates a restaurant that’s just getting by from one that’s truly thriving. Let’s dig into the common sticking points I see owners wrestle with all the time.
How Often Should I Calculate Food Cost?
For real control over your numbers, calculating your food cost percentage weekly is the gold standard. Seriously. Doing it this often means you can catch problems fast.
Maybe a supplier jacked up the price of chicken, or your line cooks are getting a little too generous with the fries. Catching that in week one is a quick fix. Discovering it a month later on your P&L statement? That’s a much bigger, more expensive problem.
While you’ll still do a monthly calculation for your big-picture financial reports, the weekly check-in is your early warning system. It gives you the data you need to make smart, money-saving tweaks on the fly.
Actual vs. Ideal Food Cost Explained
This is a big one. Understanding the difference between your actual and ideal food cost is your secret weapon for finding hidden profit leaks.
- Ideal Food Cost: This is your “perfect world” number. It’s what your food cost should be based on your recipes, assuming zero waste, no mistakes, perfect portions, and no theft. It’s the cost on paper.
- Actual Food Cost: This is the real number you get after you’ve counted your inventory and run the full COGS formula. This is what you actually spent.
The gap between your ideal and actual food cost is pure, lost profit. Your main goal in cost control is to shrink that gap by tightening up portioning, cracking down on waste, and keeping your inventory secure.
Should I Include Comped Dishes or Staff Meals?
Yes, you have to account for them. Don’t just let these items disappear from inventory, or you’ll artificially inflate your food cost and get a warped idea of how efficient your kitchen is.
The cost of comped meals, anything that was spoiled, and the food your staff eats should all be recorded as part of your Cost of Goods Sold (COGS). The key is to track them under a specific expense category in your accounting software. This way, you can see exactly what these necessary costs are doing to your bottom line without messing up your core food cost percentage.
Does This Percentage Include Labor Costs?
Nope. Food cost percentage strictly measures the cost of your ingredients against your food revenue. Labor is a whole other beast—an equally critical expense, but a separate one.
If you want a more complete picture of your operational health, you need to calculate your restaurant’s prime cost. This is the big one: it’s the sum of your total COGS (food and beverage) plus all your labor costs, including taxes, insurance, and benefits.
Ready to elevate your dining experience without the hassle of cooking? Culinary Collective Atl offers premier private chef services in Atlanta, crafting personalized menus for any occasion. Transform your next event by visiting us at https://www.theculinarycollectiveatl.com.